By John Clarke of Team Sailing
Fixing our position, and calculating our speed and course – the EP. See diagrams below.
In another article we went through how to measure distance and bearing on a chart, using a Portland plotter and dividers. We also looked at variation on a chart, i.e. the difference between the true north pole and the magnetic north pole.
This month we shall examine putting this into practice and also look at estimating your position.
For this exercise we shall pretend that we are on passage from St Peter Port, Guernsey, to St Helier in Jersey. We know that we are north-west of Jersey – but where exactly?
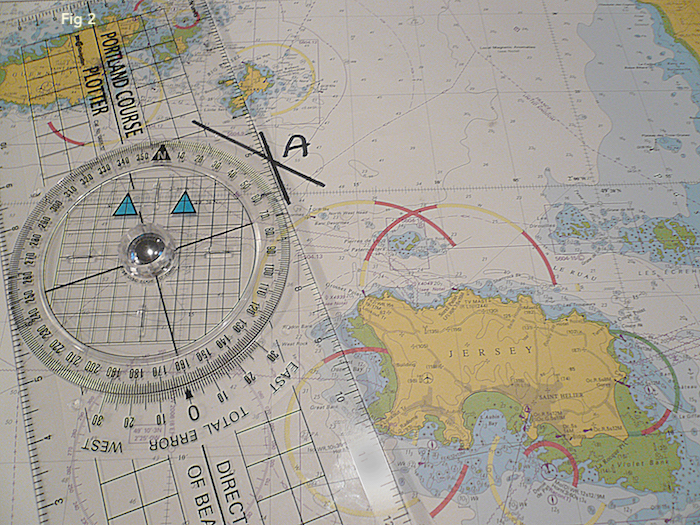
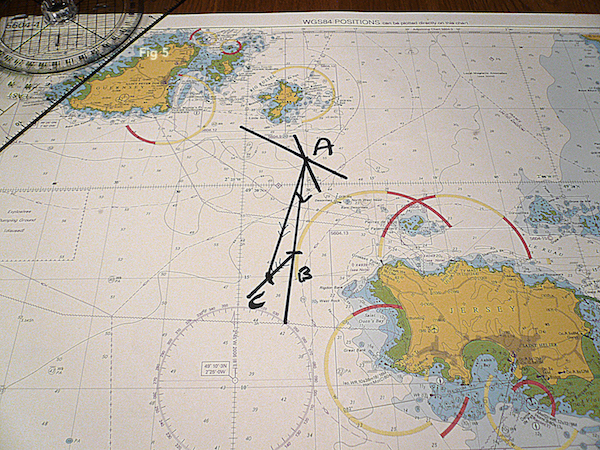
If we use the hand-bearing compass and line it up on a point on the northern edge of Jersey, we can read the bearing. It is 124°, but remember this is 124° round from the magnetic north pole, which in the Channel Isles is 2° west of the true north pole. So on the chart it will be on a bearing of 122° (T). So we now draw a line at an angle of 122°(T) from the northern edge of Jersey back towards where we think we are.
Similarly we can line up the hand bearing compass on the south west edge of Jersey, and we see that it is a bearing of 163°(M), which equates to 161°(T). So we now draw a line at an angle of 161°(T) from the southern edge of Jersey back towards where we think we are.
Where the lines cross is our position, And we are at position A on the chart. (Incidentally it always makes sense to look at the depth shown on the echo sounder as a way of confirming your position. In this case we had a depth of 52 metres, which appears to make sense.) See figures 1 and 2.
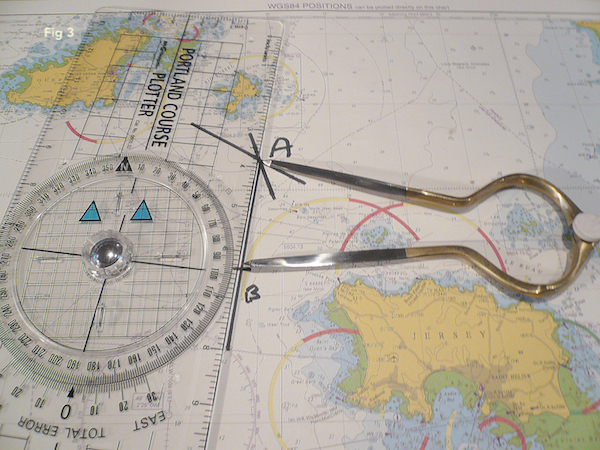
We can see from the ship’s compass the direction we are sailing along, in this case 190°(M), which equates to 188°(T). And an hour later we can see from the ship’s log that we have covered 5.4 nautical miles through the water. So we can measure 5.4 miles from the latitude scale and this will give our position as B – usually called the dead reckoning position. See figure 3.
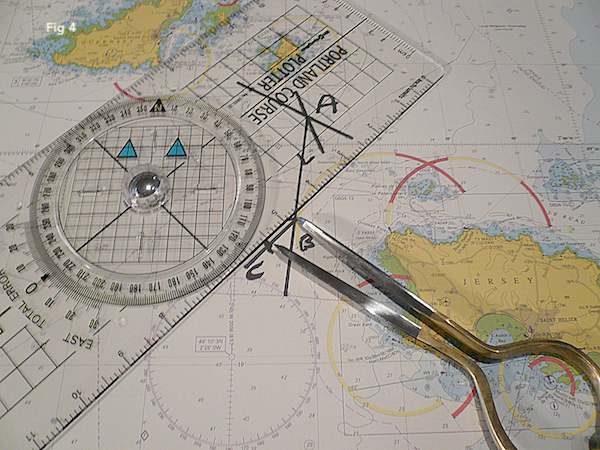
However we are not on a lake, we are on a moving body of water, so we have been pushed in the direction of the tide. Referring to the tidal stream atlas or the tidal diamonds (this will be covered in a later article), we see that the tide has moved in the direction of 225°(T) at a rate of 1.6 knots (i.e., 1.6 nautical miles during the hour).
So what we must do is to draw a line from B in the direction of 225°(T), and a length of 1.6 nautical miles, which makes our estimated position after the hour at point C. See figures 4 and 5. Incidentally we would mark an EP with a triangle, as opposed to a circle for a fix, with a dot in it as a shorthand to the next watch that this position is estimated…
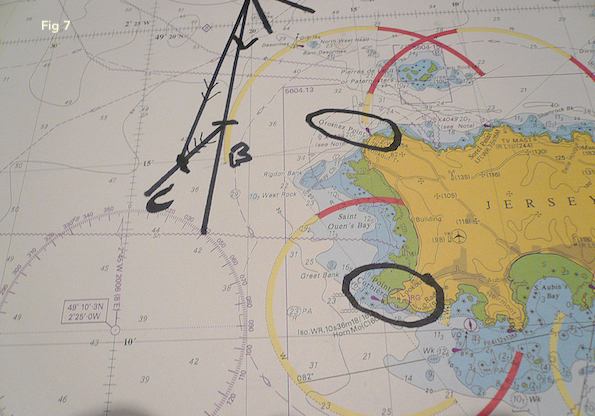
We can work out our Course over the Ground (COG) and Speed over the ground (SOG) using the plotter and dividers, and we read these as COG of 196°(T) and an SOG of 7.1 knot 7s (nautical miles per hour) See figure 6.
Incidentally we can confirm this by doing a visual position fix, using the headlands at Point Corbiere and Grosnez Point, as we did earlier when we found that we were at A. See figure 7.
Any discrepancy will be caused by a combination of: insufficient tidal data, estimating leeway wrongly (again this will be covered in a later article), or the ship’s log not reading accurately.


From Classic Sailor No4